Windows Network Analysis
Room Link: https://tryhackme.com/r/room/windowsnetworkanalysis
Windows Network Analysis
Viewing Named-Pipes
Named-pipes are a method used by the Operating System to perform inter-process communication. Named-pipes can be either local or network-based. This task will show you how to list network-based Named-pipes, which can indicate processes communicating with another host (I.e. a file share or file upload).
System Resource Usage Monitor (SRUM)
The SRUM is a Windows feature that tracks the last 30 to 60 days of resource usage, such as:
Application and service activity
Network activity, such as packets sent and received
User activity (I.e. launching services or processes).
In a database (SRUDB.dat) on the host, this can be found at C:\Windows\System32\sru\SRUDB.dat.

However, we will need to use external tooling to process this database as there is no built-in utility that can be used to gather the information that we need. It should be noted that, during a live acquisition, this file is locked by Windows, so we will need to export it to our own machine. We can use utilities such as FTK Imager or KAPE to retrieve this.
Using KAPE's SRUMDump module
Once we have retrieved the SRUDB.dat file, we can use the srum-dump utility to analyse this database. After downloading the srum-dump executable and SRUM template from the repo, launch the executable and fill out the pop-up with the relevant information:
Path to the exported SRUMDB.dat on our other analyst machine
Path to the srum-dump template
Path to output the srum-dump analysis file
We can leave the registry boxes blank for now.

And now let srum-dump analyse. This may take a couple of minutes. Feel free to grab a glass of water and stretch your legs.

After a few minutes, the analysis will be complete. We can go to our output directory and open the Excel file.

Please note that this process has already been done for you on the practical VM.
Windows Firewall Logs
Before proceeding, check if logging is enabled. By default, Windows Firewall will log to C:\Windows\System32\LogFiles\Firewall.


After a few minutes, we can open the pfirewall.log located in C:\Windows\System32\LogFiles\Firewall. Here, we can see connections that Windows Firewall has allowed or dropped.

You can, of course, view this using the gc (Get-Content) cmdlet in PowerShell:
Using the Get-Content module to output the Firewall log
Answer the questions
What is the full name of the Windows feature that tracks the last 30 to 60 days of system statistics?
System Resource Usage Monitor (SRUM)
What is the full path to the directory that Windows will output Firewall logs to?
C:\Windows\System32\LogFiles\Firewall\
Network Analysis via PowerShell
PowerShell is an extremely powerful and extensive command shell for Windows with its own scripting language. It can be used to automate tasks, audit and configure the Windows operating system, and it is already provided on the machine.
We can use PowerShell to retrieve a lot of the same information that other tools can. Knowing how to retrieve network activity using PowerShell is a great "first step" in triaging a machine, especially when you can't immediately throw your toolset at it. This task is going to show you some example commands for PowerShell.
Show TCP Connections and Associated Processes
This snippet can be a nice "quick win" to see what processes are making TCP connections and the IP addresses, where you can quickly find anomalies for further investigation.
Using the Get-NetTCPConnetion cmdlet
Show UDP Connections
The following snippet will display all UDP connections. Whilst the majority of applications will be using TCP, viewing the UDP connections are helpful in building a picture of the activity of the machine. Additionally, hosts who are infected with joining a botnet, may use UDP to communicate, such as in the case of flood attacks.
Using the Get-NetUDPEndpoint cmdlet
Sort and Unique Remote IPs
This snippet can be used to list the IP addresses associated with ongoing TCP connections on the host, where they are then sorted in numerical order and uniqued (removing duplicates). The -Unique filter on Sort-Object is important because IP addresses can make multiple connections (I.e. a browser). The output from this snippet can be exported, where the IP addresses can be compared to threat intelligence or any possible events from security applications such as an IDS.
Using the Get-NetTCPConnection cmdlet with a remoteaddress filter
Investigate an IP Address
If we wish to drill down into an IP address, we can use the following snippet to gain some more insight. For example, in the snippet below, we can see the connection status, the date and time it was initiated, the local port (local host) and a remote port (remote host), and the process causing that connection. This could be an excellent way to discover connections that an IP is making to a process. For example, a process from payload.exe connecting to port 4444 on an IP address.
Specifying an IP address to Get-NetTCPConnection
Retrieve DNS Cache
The DNS cache on a host is a locally stored "database" of DNS records and their corresponding host stored on the host, used to remember what domains match up to what IP address, improving performance (i.e, the host already knows where the domain points to). Reviewing the cache can be used to indicate what domains have recently been contacted.
Using the Get-DnsClientCache cmdlet
View Hosts File
The hosts file contains "override" domains and the associated IP address on the host. You will be familiar with this concept if you have completed challenges on TryHackMe. It is a useful method of mapping a domain to an IP without relying on a DNS server.
Attackers use the hosts file to redirect traffic to something they control, as the host will take preference from the hosts file before reaching out to a DNS server. For example, an attacker may be able to tell the host to send all traffic destined to http://exampledomain.com (which is owned by the business) to the attacker's servers instead...whilst all the user will see is http://exampledomain.com.
There are numerous examples of this being used in banking trojans, phishing attacks, etc, where the user thinks they're logging into the correct page because the URL matches up. Meanwhilst, the traffic is being sent to the attacker's servers instead.
Using gc to output the last four lines of the hosts file
Querying WinRM Sessions
Windows Remote Management (WinRM) administers a system over the command line. This is useful for automated scripts (and the such) by the network administrators. However, Attackers can abuse this same functionality in a stealthier way than connecting to a device over, say, RDP, to execute PowerShell commands remotely.
Querying WindowsRM sessions is essential, especially as sessions can persist (i.e. backdoors).
Querying RDP Logs
Querying active and recent RDP connections is another "quick win" to understand the current activity on the host. The qwinsta command will show the user status, as well as source of the connection.
Using qwinsta to display remote desktop sessions
Querying SMB Shares
Using the Get-SmbConnection to display established SMB Connections
Answer the questions
What cmdlet can be used to display active TCP connections?
Get-NetTCPConnection
What cmdlet can be used to display the DNS cache on the host? Get-DnsClientCache
What command can be used to list all active RDP sessions on the host? qwinsta
Internal Tooling
Packet Monitor (Pktmon)
Packet Monitor is a Microsoft-developed packet sniffing tool provided with Windows 10, Windows Server 2022 and Server 2019 that works on the network stack. A "cheatsheet" of the commands has been provided in the table below:
pktmon start
Start a PacketMonitor capture.
pktmon stop
Stop a PacketMonitor capture.
pktmon reset
Reset the count of packets that PacketMonitor has captured.
pktmon counters
View the amount of packets PacketMonitor has captured across the interfaces.
pktmon etl2txt
Convert a PacketMonitor capture file to a text file.
pktmon etl2pcap
Convert a PacketMonitor capture file to a pcap.
Starting a PacketMonitor capture
Netstat
Netstat is another Microsoft-developed utility that can be used to review TCP/UDP connections on the machine. Similar to Packet Monitor, this utility is already provided on Windows.
To begin, we can launch a new cmd and enter netstat -a. This will instruct Netstat to list all active connections.
Using Netstat to capture network traffic on all interfaces
However, as you'll come to notice, this generates a lot of noise. Netstat can be configured to dive deeper into some of these connections as well as filter out some of this noise. A cheatsheet of some options has been provided in the table below.
netstat -a
Display all currently active TCP connections and TCP/UDP ports.
netstat -b
Display the executable responsible for the connection (i.e. payload.exe).
netstat -o
Display all TCP connections and include the process ID.
netstat -p
Display connections by protocol. Options include TCP, UDP, ICMP, and the IPV6 iterations.
It is worth noting that these options can be combined together. An example of this is in the snippet below, where -a and -b are used to show active TCP connections and the executable responsible for them.
Using Netstat to capture network traffic on all interfaces
Viewing Network Connections With PID
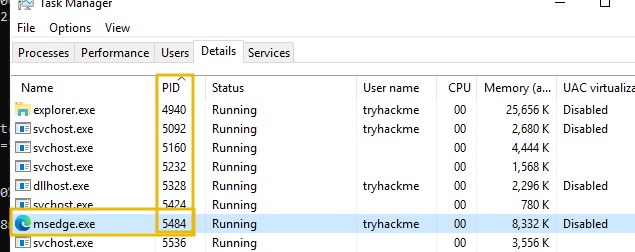
Using Netstat to show active connections and associatedPID
We can then use resources such as Task Manager or pmon to look for the process' PID.
Exporting Netstat
The output of Netstat can also be exported by using a redirection (C:\Users\tryhackme:~$ netstat -a -o > netstat.txt). This is extremely helpful when we export or search the logs.

Answer the questions
What netstat flag can we use to display the executable responsible for a connection?
-b
If we wanted to display all TCP connections and the associated process ID using netstat, what flag would we use?
-o
What special character can we use to save the output of netstat to a text file?
>
Practical
Answer the questions
Use the Get-NetTCPConnection PowerShell cmdlet to list the connections currently active.
A popular port for reverse shells is currently active. What is the port number?
If nothing sticks out, wait a few minutes and run the command again.
Victim

What is the name of the process that is connecting to the C2 server?
Victim

What is the domain that has been added to the workstation's host file?
Victim

Analyse the SRUM database. There is another process that has sent a large amount of bytes, indicating data exfil. What is the full path to the process (as listed in SRUM)?
\device\harddiskvolume3\program files\updater\exfil.exe

Finally, analyse the SMB shares present on the analyst machine. What is the name of the share that stands out?
Victim

Last updated